Tableau transforms raw data into intuitive charts and graphs, making analysis accessible for everyone.
Create dynamic dashboards that update in real-time for instant, actionable insights.
Available on Windows, Mac, iOS, Android, and Web, making Tableau accessible anytime, anywhere.
Extend Tableau's functionality by integrating it seamlessly into your existing workflows.
Use Tableau in multiple languages, including English, French, German, and more, for global reach.
| Pricing Model | Freemium, Paid |
| Platforms | IOS, Android, Chrome |
| Languages | English, French, German, Japanese, Spanish, Simplified Mandarin |
| APIs | Available |
| Founding Team | Christian Chabot, Pat Hanrahan, and Chris Stolte |
| Launch Year | 2003 |
| Category | Analytics |
| Website | Visit Website |
Tableau, established in 2003 by Christian Chabot, Pat Hanrahan, and Chris Stolte, is a leading analytics platform dedicated to helping individuals and organizations see and understand data.
Tableau is a powerful yet user-friendly tool designed to help you go beyond just analytics and transform your data into actionable insights. Whether you're focused on data analytics, web analytics sites, or the analytics of websites, Tableau has the tools to simplify and enhance your workflow. Tableau isn’t just about analyzing data; it’s about empowering you to visualize and understand it like never before.
Tableau enables users to connect, visualize, and share data seamlessly. By integrating various data sources, it allows for the creation of interactive dashboards and reports that provide real-time insights. This capability aids users in identifying trends, uncovering hidden patterns, and making data-driven decisions effectively.
Interactive Dashboards: Tableau allows you to create dynamic dashboards that update in real-time. Whether you're exploring websites analytics or business performance data, these dashboards provide immediate insights to help you stay on top of trends.
Drag-and-Drop Interface: With its intuitive interface, Tableau makes it easy to analyze and visualize data without coding. Whether you're working with general tableau data or diving into specific website performance, the process is simple and accessible.
Data Connectivity: Tableau connects seamlessly to various data sources, including spreadsheets, databases, and online platforms. This flexibility allows you to combine your data—whether from a local source or a web analytics site—into a single view.
Advanced Analytics: Tableau goes beyond traditional data analytics by offering advanced statistical tools and predictive models. These features are invaluable for understanding everything from sales trends to the analytics of websites.
Collaboration and Sharing: Tableau simplifies sharing insights, whether you're collaborating with a team or publishing dashboards on tableau.com. Its secure environment ensures your data remains accessible only to the intended audience.
Simplifies Data Analysis: Tableau helps you turn complex data—whether business metrics or websites analytics—into clear, actionable visuals.
Saves Time: Automate updates and generate reports effortlessly with the Tableau reporting tool, reducing time spent on manual tasks.
Enhances Decision-Making: By providing a deeper understanding of tableau data or insights from a web analytics site, Tableau supports better, data-driven decisions.
Improves Collaboration: Share insights seamlessly through the Tableau website or directly on tableau.com, ensuring everyone has access to up-to-date information.
Tableau offers a variety of products to cater to your needs:
Tableau Desktop: Perfect for creating and analyzing data. This Tableau reporting tool is priced at $70 per user per month, billed annually.
Tableau Server: Share your data securely across your organization. Ideal for teams managing websites analytics, pricing depends on user count and deployment.
Tableau Cloud: A fully hosted platform ideal for creating and sharing dashboards related to web analytics sites or any other data. Pricing starts at $15 per user per month.
Tableau Public: A free solution for exploring, creating, and sharing data visualizations online, whether for general use or analytics of websites.
Whether you're focused on advanced data analytics, understanding the analytics of a website, or leveraging tableau.com for business insights, Tableau has the features and flexibility you need. Its wide range of tools—from web analytics sites insights to enterprise-level data reporting—ensures your data works harder for you. Tableau is more than just a tool; it’s a complete solution for turning data into decisions.
Explore more such apps under Analytics category and don't forget to share your experience.

Loading courses...
Loading...
Loading...
Loading...
Loading...

Learn how to integrate ChatGPT into your applications with personalized support from an AI mentor....

Chahe aap property dealer ho, doctor, kisaan, lawyer, teacher, vet doctor ya thekedar – AI...

Chahe aap school ke student ho, college mein ho ya competitive exams ki tayari kar...

Chahe aap ek homemaker ho, maa ho, housewife ho ya apne ghar aur परिवार को...


Learn how to build systems that learn, adapt, and evolve with a one-on-one AI-powered mentor,...

Excel in Marketing with AI: Master Automation, Personalization, and Data-Driven Strategies
.png?updatedAt=1728211623377)
Get ahead with a personalized learning experience driven by our AI mentor. Master smart ChatGPT...

Learn how to streamline operations with AI-driven automation. Your personalized AI mentor helps you apply...

Learn how to effectively communicate with AI systems by creating accurate and impactful prompts. Your...
AI-powered data analysis and visualization platform.
FormulaBot is an AI-powered tool designed to make working with data in spreadsheets like Excel and Google Sheets simple and efficient. It helps us... Read More

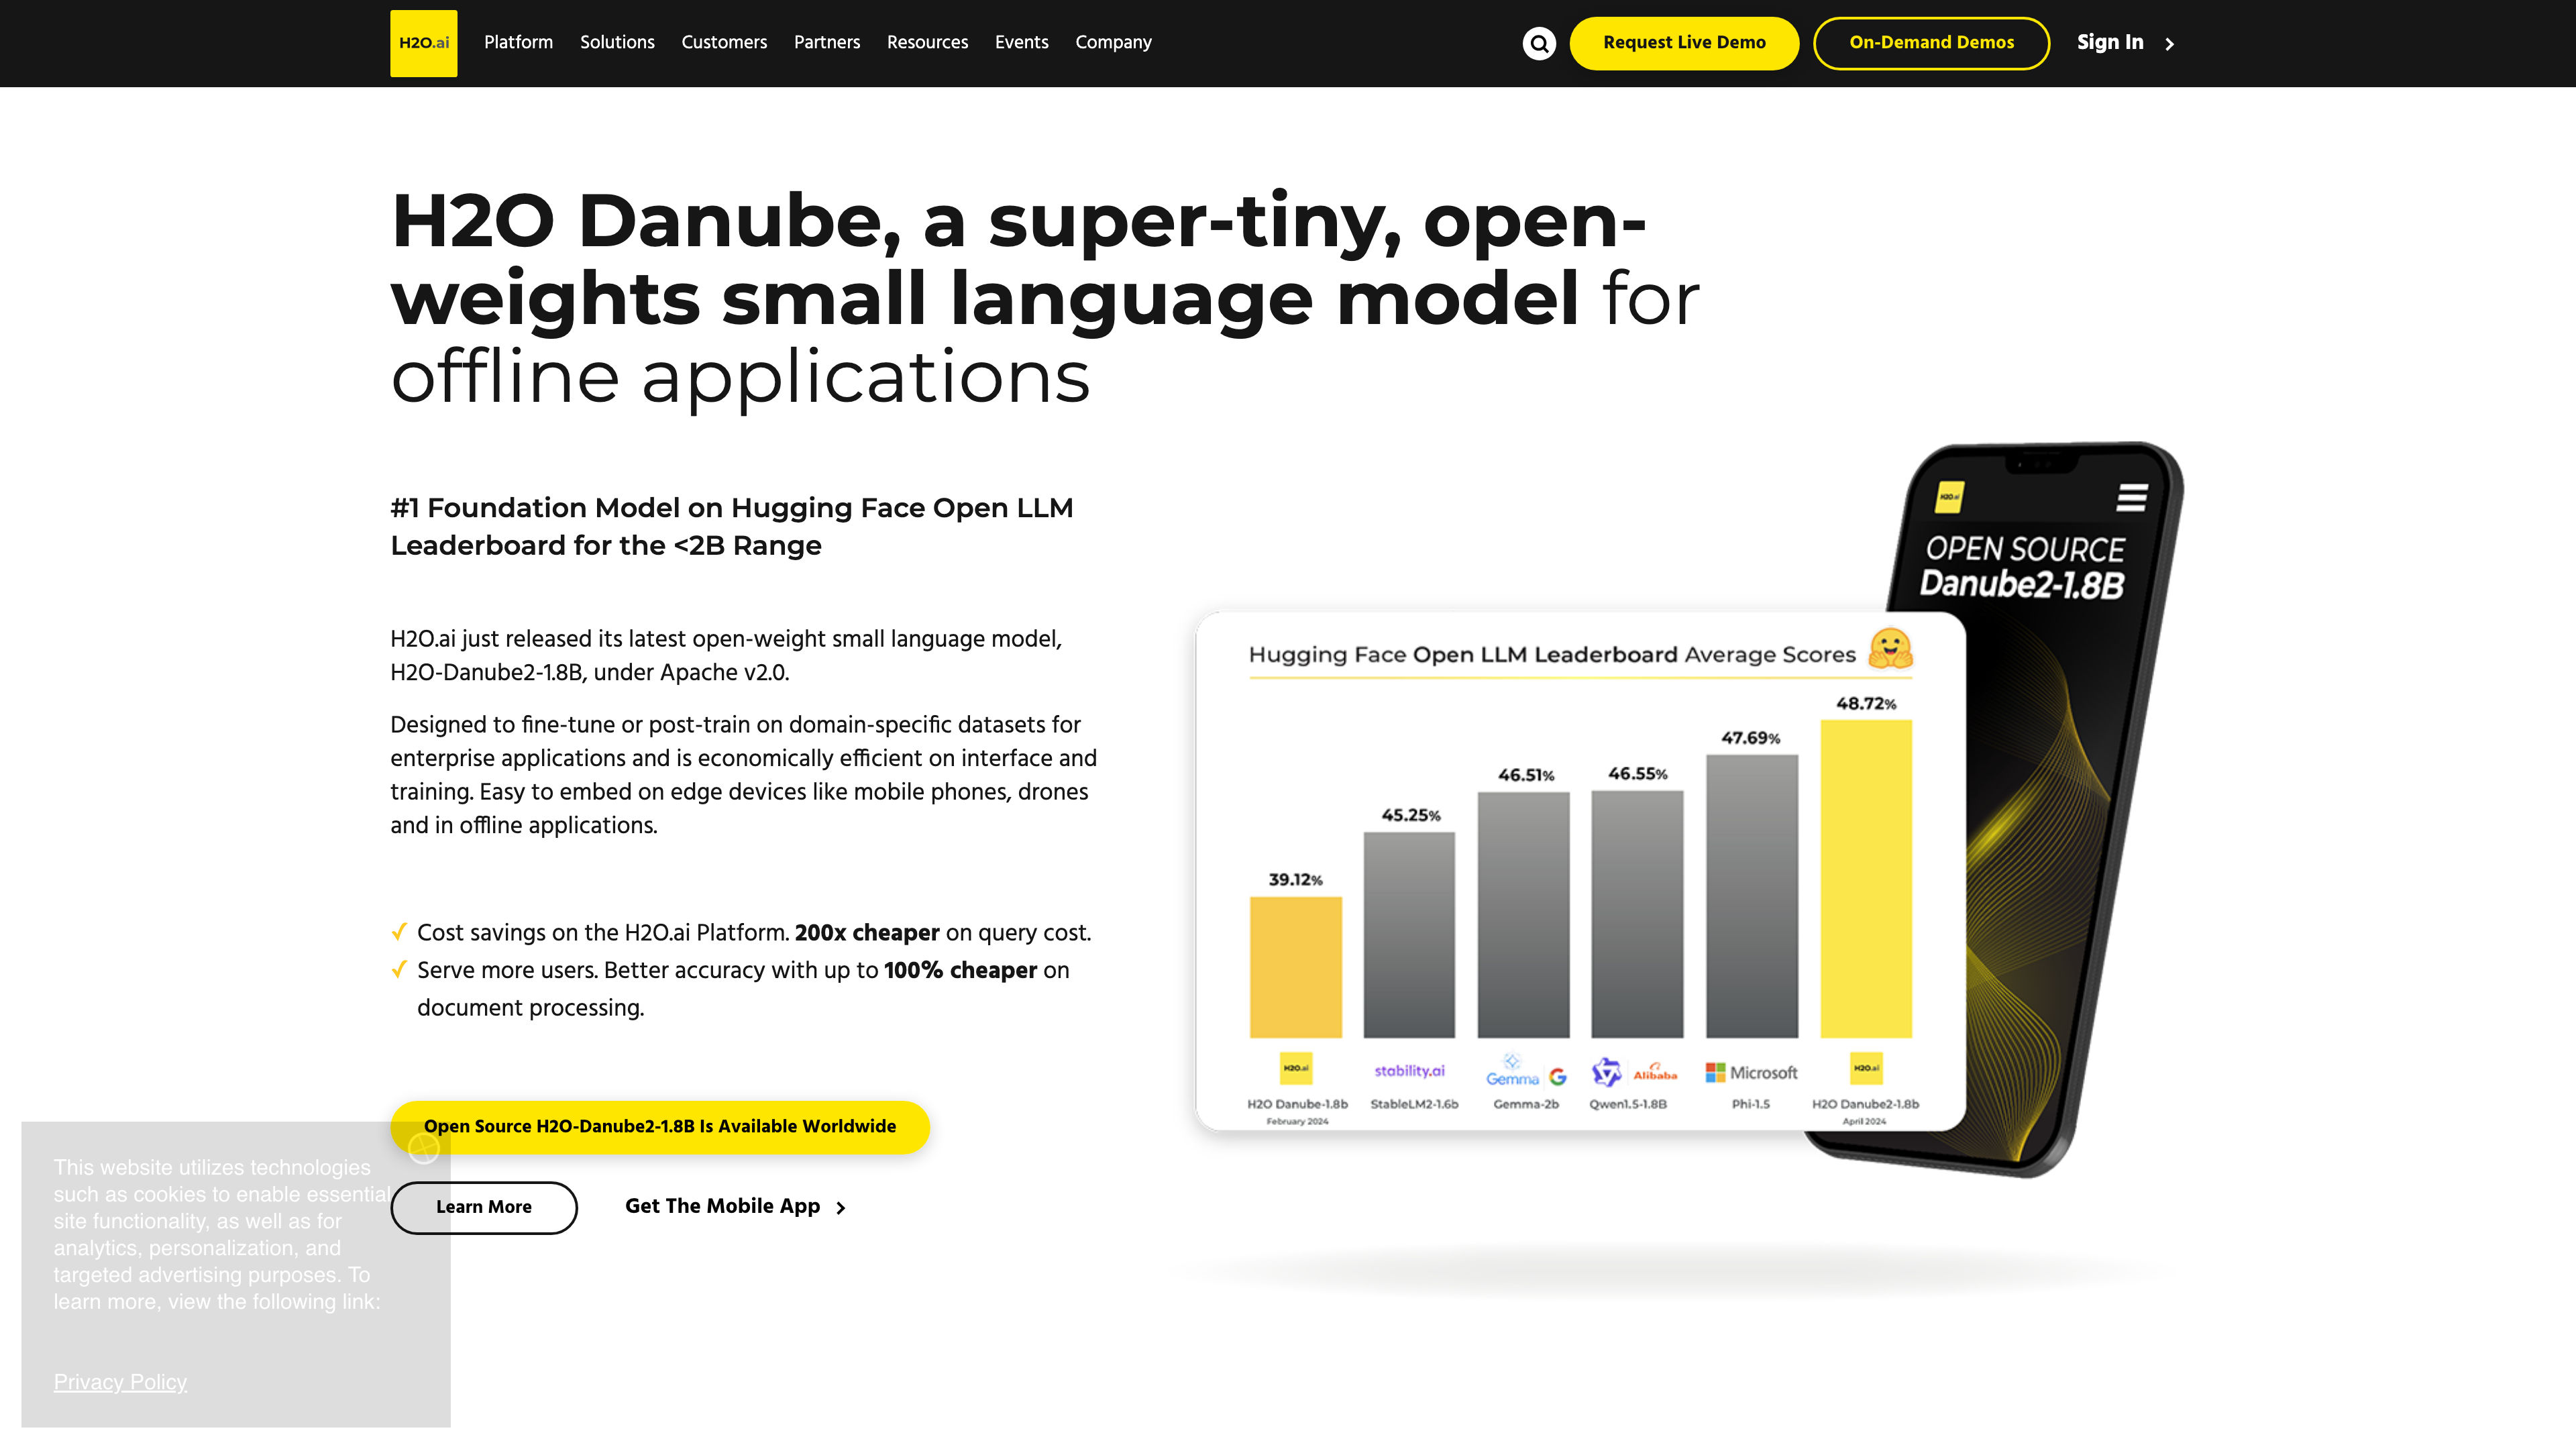
Transform your business with open-source AI technology and machine learning solutions.
H2O.ai is a company that creates tools to help businesses use artificial intelligence (AI) and machine learning (ML) easily. Their main product, H2O, ... Read More

AI-powered data analysis made simple.
Julius AI is a user-friendly tool that simplifies data analysis, making it accessible to everyone, even those without technical expertise. It allows y... Read More

Transform your data with Power BI for actionable insights and interactive dashboards
Microsoft Power BI is a user-friendly tool that transforms complex data into clear visuals, making it much easier for businesses to understand their d... Read More
